|
Bookmark this page
Tell a Friend
|
|
| Home | Public Schools | Private Schools | School Locator | |
| Public Schools » California » Hayward » Impact Academy Of Arts & Technology » Enrollment | |
Impact Academy Of Arts & Technology, Hayward CA - Enrollment | |
|
||||||||||||||||||||||||||||||||||||||||||||||||||||||||||||||||||||||||||||||||||||||||||||||||||||||||||||||||||||||
|
2011-2012 school year
Enrollment
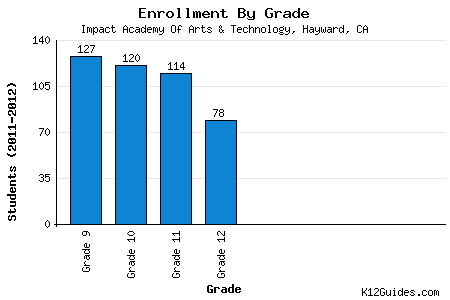
2011-2012 school year
Enrollment by Grade
Other |
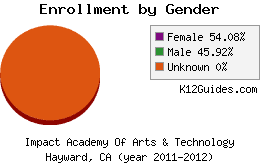
2011-2012 school year
Enrollment by Gender
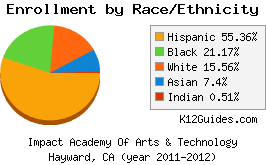
2011-2012 school year
Enrollment by Race/Ethnicity
| |||||||||||||||||||||||||||||||||||||||||||||||||||||||||||||||||||||||||||||||||||||||||||||||||||||||||||||||||||||
Copyright 2004-2024, K12Guides.com. All rights reserved. Data on this site are composed from various government and commercial sources. K12Guides do not guarantee the accuracy or timeliness of any information on this site. Use at your own risk. | ||||||||||||||||||||||||||||||||||||||||||||||||||||||||||||||||||||||||||||||||||||||||||||||||||||||||||||||||||||||